This article introduces the concept of Production Possibility Frontier (PPF). It gives the definition of Production Possibility Frontier (PPF) as well as shows how the Production Possibility Frontier (PPF) diagrams are drawn and how to interpret them.
What is Production Possibility Frontier (PPF)?
Resources in the economy are scarce, so people need to make choices as to where the limited resources will be allocated. Once this choice has been made as to which product to make, the other product must be given up. This is an opportunity cost.
Production Possibility Frontier (PPF) is a graphical representation showing what an economy can produce within a fixed time period using its limited resources. It shows resources, as if they are fully and efficiently used, and how resources can be allocated between two different products. In short, Production Possibility Frontier (PPF) shows the maximum potential output of an economy.
What is the Production Possibility Frontier (PPF) diagram?
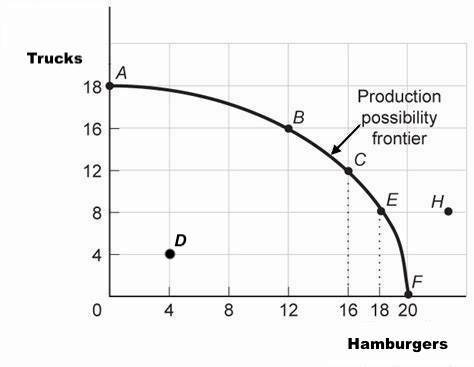
Let’s take a look at the following example of the country where two different goods are produced – trucks and hamburgers. The following is a model showing these two goods produced with full employment at the maximum production capabilities.
The trucks and hamburgers in that country are produced at the maximum output possible. Trucks are used by companies in the production process, hence are considered capital goods. And, hamburgers are bought by individual customers, hence are considered consumer goods.

The Production Possibility Frontier (PPF) curve indicates the combination of trucks and hamburgers that the society can produce at a given moment in time using all of its resources (factors of production) efficiently – land, labor, capital and enterprise.
The various combinations of output when all resources are being utilized the most efficiently are as follows:
Trucks Hamburgers
18 0
16 12
12 16
8 18
0 20
It is worth noting that the Production Possibility Frontier (PPF) only connects efficient production combinations. The highest valued combination is at Point C to produce 12 trucks and 16 hamburgers.
How to interpret the Production Possibility Frontier (PPF) chart?
Let’s now take a look at the Production Possibility Frontier (PPF) chart and what we can learn from it.
1. Producing only one product instead of both
Output at Point A is when all available resources are used for producing trucks.
Output at Point F is when all available resources are used for producing hamburgers.
2. Economic changes
Outputs at Point B, Point C and Point E are when all available resources are used for producing both trucks and hamburgers.
Various economic changes in a country affect the curve. This could be labour who have more skills and experience appropriate for producing capital goods such as trucks moving the curve from Point C to Point B.
If a country chooses to produce more capital goods, it must sacrifice resources allocated to consumer goods for producing hamburgers and vice versa.
A move along the curve illustrates the concept of opportunity cost.
All points along the frontier such as Point B, Point C and Point E show the trade-off between two different goods for the society. To get more of one, we must give up some of the other. If we want to produce 12 trucks instead of 8 trucks, we need to produce 16 hamburgers instead of 18 hamburgers. Therefore, an increase in production of capital goods requires a decrease in the amount of consumer goods.
An economy will move the most suitable resources first. These resources are far more efficient and thanks to it we are able to produce more. For example, if an economy wishes to produce more capital goods, people must accept less consumer goods and will first move those resources which are better suited to producing capital goods.
3. Inefficient production
Any points inside the frontier, such as producing four trucks and four hamburgers, are attainable (possible) at Point D, but do not utilize the society’s resources efficiently. It is because more than four trucks and more than four hamburgers can be produced in the country.
Production inside the Production Possibility Frontier (PPF) indicates inefficient use of resources. If the output of an economy is at Point D (inside the curve) resources that are available are not being used efficiently or some are not used at all. In fact, all points on or inside the frontier are attainable, but Point B is better than Point D.
Sometimes nations do not achieve production efficiency because they have unemployed labor, unused capital or perhaps the economy is in recession. When the economy is in recession it is becoming smaller, like much of the world economy in 2008 during the financial crisis leaving many people unemployed and office buildings empty.
4. Unattainable production
Any points outside the Production Possibility Frontier (PPF), such as Point H, are unattainable (impossible) with given resources and the current stage of technology. The output outside the curve is impossible to achieve with existing set of resources.
5. Economic growth
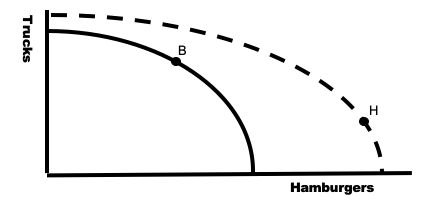
We know that it is not possible to produce the number of resources at Point H which is outside the curve. However, it is possible for the curve to ‘shift outwards’, if the economy experiences economic growth.
Therefore, economic growth in a country will shift the Production Possibility Frontier (PPF) curve to the right side. More consumer goods and more capital goods are being produced in a country now.

How to stimulate economic growth in the country?
Economic growth is possible in several ways, e.g. increase in economic resources, increase in productivity, expansion of industrial capacity, competitive advantages and favorable governmental policies. The government can use expansionary fiscal policy and monetary policy to increase aggregate demand (raise government spending and lower TAX rates) and decrease interest rates to increase the supply of money.
On another hand, economic recession will shift the curve to the left, and decrease the production capacity of the society.
Summary
In summary, Production Possibility Frontier (PPF) is used to help show the optimum use for the economy’s resources. It is a tool to show how making choices can cause opportunity cost in the society.
It is also a tool used by economists to help show efficiency, recession and growth.
 Articles: 1,512 · Readers: 757,000 · Views: 2,260,160