 Articles: 1,400 · Readers: 740,000 · Views: 2,209,961
 Organizational structure of a business is typically illustrated on a diagram called an organization chart.
An organizational chart shows the way in which the chain of command works within the organization.
What is organizational chart?
A typical organizational chart is a diagrammatic representation of a business’s formal organizational structure. Often this formal structure is set out on paper in the form of an organizational chart.
Formal groups that carry specific functions are established such as a team of sales representatives in the marketing department or a team of accountants in the finance department.
An organizational chart deals with issues such as:
- The overall responsibility for making decisions in a firm.
- Formal relationships between different departments and different employees across the organization.
- Formal channels of communication including vertical channels and horizontal channels.
- The number of subordinates reporting to each manager in a firm (span of control).
- The ways in which accountability and authority are be passed down the organization from the top to the bottom (chain of command).
- The supervisor, manager or director to whom each employee is answerable to and should report to on daily basis.
While most formal groups illustrated on the organizational chart are permanent, the business can also set up temporary groups to work on a particular issue or problem.
Example 1: Iverson was bored with his work. He was a telephone operator in a large telephone banking firm. The business received calls from customers who wanted to use banking services but did not have time to go to a bank branch. Iverson worked in a team, called A-Team, with other colleagues, Venus and Shirley. They were supervised by Nicole who was under the authority of Odie. They were two other groups of telephone operators, B-Team and C-Team. These two teams were the same size as A-team. They also had their own supervisors who reported to Odie. All calls were recorded and supervisors could listen in to make sure that all workers were polite and helpful to customers. Telephone operators were only allowed to do certain tasks for customers. Other jobs, such as transfers of large sums of money, had to be referred to a supervisor or manager. Telephone operators had to aim to answer 20 calls each hour. No wonder Iverson was bored with his work!
Importance of organizational charts
An organization chart shows five main features of every business organization including:
- Functional departments. There are usually four functional departments within a business including marketing, operations (production), finance and Human Resources (HR) with each being headed by a director. An organizational chart shows how different areas of the business link to one another and how each department is organized internally.
- Levels of hierarchy. There are usually five hierarchical levels including the CEO at the top level, directors of functional departments, managers, supervisors and team leaders as operatives on the bottom level. An organizational chart shows which line manager different workers report to, so that there is formal accountability.
- Span of control. This is the number of employees directly accountable to a single director, manager or supervisor. An organizational chart shows which people have authority and the extent of the responsibility they have for others.
- Chain of command. This shows the various formal lines of authority in the organization. The route is used to communicate and pass down of authority to lower levels. The organizational chart shows which people have direct line authority over other such as the Marketing Director has line authority over the sales manager who has the authority over all employees in the sales team.
- Official channels of communication. This is the route that formal corporate messages are communicated within the organization. The organizational chart is going to show that communication only concerning the finance team will travel from the CEO, to the Finance Director, the Finance Manager until the finance staff.
- Delegation. The means passing down authority from higher to lower levels in order to make decisions and perform tasks. The organizational chart shows who has accountability, authority and responsibility for a particular job.
Examples of organizational charts
Different organizations have different organizational structures while flexibility is the key to success in organizational structures.
How does one design a suitable modern organizational structure? Here are six different types of organizational charts:
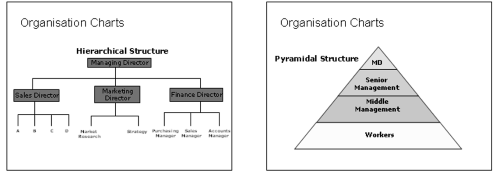
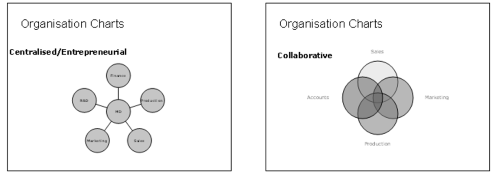
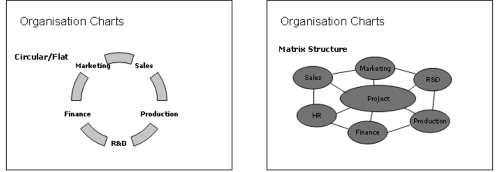
Many modern organizations have tended to move away from old hierarchical, top-down structures to ones in which employees are empowered to make decisions and think for themselves, often in matrix type structures.
Weaknesses of organizational charts
There are several drawbacks of organizational charts that managers should be concerned with such as:
- Being inconsistent with reality and how the business really works.
- Implying that formality between certain departments exist while it does not.
- Failing to capture the informal organizational structure and invisible connection between people.
- Downgrading the role of customers and lower-level employees who do not have managerial responsibilities.
- Imposing hierarchical pyramidal structure as the default structure for every single business organization.
- No addressing the potential power and authority struggles between managers and workers.
In conclusions, an organization chart helps to show the formal structure of the entire business organization. By looking at the organizational chart, each and every employee will see their position in the business and will be able to relate to other parts of the business.
