 Articles: 1,432 · Readers: 748,000 · Views: 2,231,258
 This article identifies situations where the market system can fail causing market failure: when prices are too high, when prices are too low and when there are fluctuations in price.
It also explains with accurate diagrams solutions to the three aforementioned examples of market failure: minimum price, maximum price and a buffer stock policy.
Market failure
Market failure occurs when the mechanism of supply and demand fails to allocate resources in the most socially desirable way.
In fact, market failure can occur through a number of different ways, including prices being too high, a lack of competition between companies and the over-supply of demerit goods.
1. Cause of market failure – Price is too high
The government may feel the price of a good is too high because the good is a necessity or is a merit good. If some consumers are unable to access the good it may have negative effects on society. For example, if consumers on lower incomes are unable to pay for housing, there could be an increase in the number of homeless people.
A society that is not providing basic necessities for all could be accused of market failure, or misallocating resources.
When this problem exists in a major city such as Shanghai or London the movement of labor can be prohibited. This prevents the efficient allocation of labor, or market failure.
Others problems could result from this issue, such as an increase in begging, theft and other crimes.
In order to remedy this situation the government may introduce a maximum price, which will limit how high prices can be in the market. In reality, the government usually enforces the policy on rent in a limited part of the city.
 | Solution to price is too high? Maximum price policy
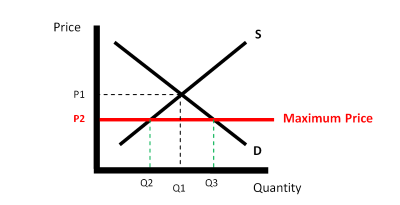
The goal is to make sure that lower income groups can afford the product or service. This maximum price must be below the market price (equilibrium price) in order to be effective.
This may be applied to many goods and services such as housing, health care or transport. Maximum prices decrease supply and increase demand causing a shortage to exist. The government may provide the good themselves to provide for the gap, though the policy does not suggest this is happening or necessary. Finally, another problem is the development of a ‘black market’, an illegal market. This could limit supply for those in the most need, as some suppliers illegally charge more as some consumers are willing and able to pay a higher price.
The diagram shows a maximum price policy. The government fixes the maximum price at P2. Then, quantity demanded (D) increases to Q3 and quantity supplied (S) decreases to Q2. The difference between Q3 and Q2 is the shortage.
2. Cause of market failure – Price is too low
If the price is too low, the income of the producers is at risk. This is a problem, if the supplier produces a necessity or a merit good. Producers may be less willing and able to produce, having significant consequences (especially in a market such as health care or agriculture) causing market failure. The government may wish to protect the income of the producer and so may introduce a minimum price
| Solution to price is too low? Minimum price policy
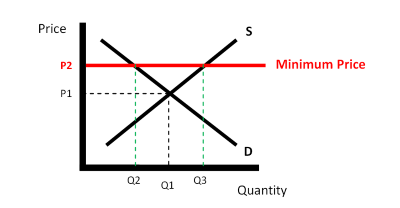
Minimum prices increase supply and decrease demand causing a surplus to exist. This minimum price must be above the market price (equilibrium price) in order to be effective.
The government may choose to buy the surplus from the producers to prevent excess production being wasted; though policy does not suggest this is happening or necessary. An example of a minimum price policy is the US butter market. Not only did the government want to ensure income for producers but they wished to protect the industry and local jobs from cheaper overseas firms, such as Australian producers.
NOTE: It is possible for minimum prices to be used to reduce the quantity demanded. The government may wish to do this in order to limit the use of demerit goods, though TAXation is a more efficient method.
The diagram shows a minimum price policy. The government fixes the maximum price at P2. Then, quantity demanded (D) decreases to Q2 and quantity supplied (S) increases to Q3. The difference between Q3 and Q2 is the surplus.
Other uses of a minimum price policy
As previously stated the government may wish to reduce the availability of demerit goods which they feel are over supplied by the market. Additionally the government may simply wish to increase the production of a particular good.
The UK government, for example, wanted to increase the amount of bio-fuels in the market – a substitute and cleaner alternative to oil based fuels.
A minimum price placed on the crop ‘oil seed rape’ encouraged farmers to grow more allowing the government to stockpile reserves to help build the bio-fuel market.
3. Cause of market failure – Price fluctuations
Price fluctuations occur when the price changes a large amount or very quickly in a cycle.
This causes market failure as producers are not receiving a clear signal from the market price about what quantity they should produce. The result is that they will provide either too much or too little in a repetitive cycle, which is inefficient.
Fluctuations are often a problem in agricultural markets as the supply is inelastic in the short term – farmers cannot change supply quickly because of the delay between harvests.
For example, if the price is higher than previously, farmers will be willing to supply more, but not able to do so as they will have to plant and then wait for the next years’ harvest.
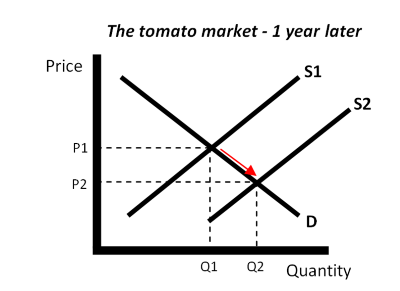
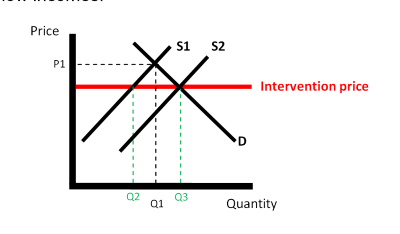
As the diagram above shows, the price has reduced from P1 to P2 because many farmers have been attracted by the higher price and have increased supply from S1 to S2. This in turn sends a signal that the market is over supplied and farmers in turn (after receiving lower revenues than expected) wish to supply less.
NOTE: Lower price may be harmful to producers, especially those in developing nations
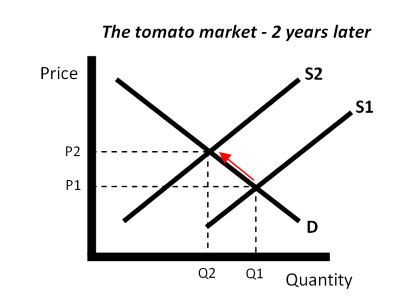
However, this cannot happen until next year, resulting in the supply curve shifting inward from S1 to S2 as seen in the diagram below increasing the price from P1 to P2.
NOTE: Higher price may be harmful to consumers, especially those on lower incomes.
This cycle will continue unless the government intervenes to correct this inefficiency which they can do with a buffer stock policy.
| Solution to fluctuations in price? Buffer stock policy
This policy is designed to maintain a more stable price level than when market forces decide the market price and quantity. By maintaining a more stable price level, the government can attempt to protect both consumers (low income groups may need such help) and the income of producers.
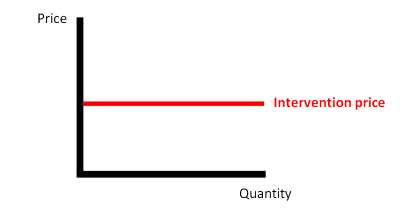
A buffer stock policy introduces an intervention price level. This is the government’s opinion about the ideal price that is fair for both consumers and producers.
A. Intervention price above market price because price too low
In the situation where farmers produced extra wheat, the market price may be below the intervention price – this can be seen below.
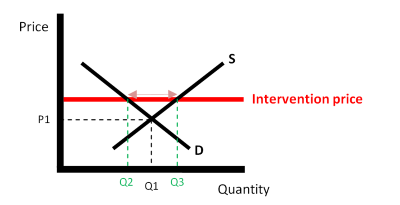
The difference between Q3 and Q2 is a surplus with the buffer stock policy in place, so the market is not at equilibrium.
Since the market price is below the required price level set by the buffer stock policy, the government needs to purchase the difference between Q3 and Q2, which will put pressure on prices and shift the demand curve as seen in the diagram below.
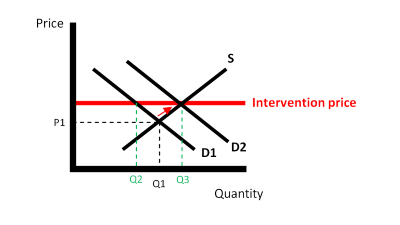
After purchasing the surplus between Q3 and Q2 from the market by the government, the market returns to equilibrium represented by the curves of S and D2. The price is more stable than before, income for producers has been protected and production ensured. The government could sell the surplus overseas, donate it as international aid or simply destroy it. However, for buffer stock policy to work properly the government should store it, if possible.
B. Intervention price below market price because price too high
In the situation where farmers produced not enough wheat, the market price may be above the intervention price – this can be seen below.
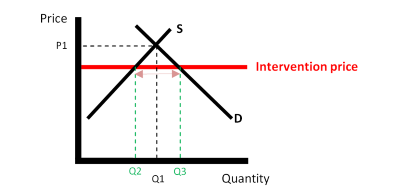
The difference between Q3 and Q2 is a shortage with the buffer stock policy in place, so the market is not at equilibrium.
Since the market price is above the required price level allowed by the buffer stock policy, due to under production, the government can supply the market using goods they have stockpiled, resulting in the outward supply shift from S1 to S2 seen in the diagram below. The market returns to equilibrium. The price is more stable than before and consumers have been protected particularly those on low incomes.
 | Problems with the buffer stock policy
Buffer stock policy is not perfect as many agricultural goods are perishable. This means that they cannot be kept for a long period of time. For example tomatoes are perishable; they will rot so are not suitable for such a policy.
The policy may be used for goods which are not so perishable, such as grain and wine. It can also be argued that the policy itself is inefficient since it encourages farmers to produce too much.
Overproduction is a misallocation of resources, though guaranteeing the supply of food is clearly important for a government. An example of a buffer stock policy is the European Union’s Common Agricultural Policy, which is often called C.A.P.
Summary of market failure caused by price fluctuations
Market failure is when the market system fails to allocate resources in a manner that is socially desirable.
Market failure may exist, if the government feels prices are too high or too low.
High prices can be remedied with a maximum price policy. Low prices can be remedied with a minimum price policy.
Fluctuations in price may also be a cause of market failure. The market can be made more stable with the implementation of a buffer stock policy.
