This article is about the definition of Aggregate Supply (AS), the Aggregate Supply (AS) curve and shifts in the Aggregate Supply (AS) curve. You will find out here how to define Aggregate Supply (AS) and understand its components, explain what causes the Aggregate Supply (AS) to shift and draw the Aggregate Supply (AS) curves to illustrate shifts in the economy.
Definition of Aggregate Supply (AS)
Aggregate Supply (AS) the total amount produced in an economy in an effort to satisfy demand. The Short-Run Aggregate Supply (SRAS) curve is similar to the normal supply curve. It is affected by price and there are other variables which can cause shifts.
Chart of Aggregate Supply (AS)
The Aggregate Demand AD curve is the graphical representation of the relationship between the GDP of goods and services at specific price levels. The Aggregate supply (AS) Curve is the graphical representation between supply of goods and services produced within an economy at a given time.

Shifts in the Aggregate Supply (AS) curve
Shifts of The Short-Run Aggregate Supply (SRAS) are caused by the following situations:
- Changes in the cost of labor.
- Changes in the cost of raw materials.
- Changes in TAXation.
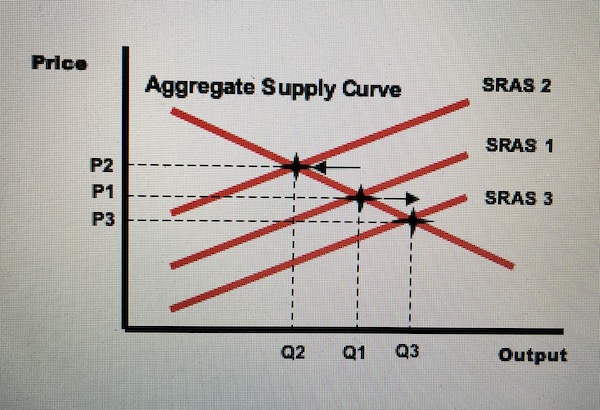
Unlike microeconomic supply shifts, the short-run aggregate supply curve will shift upwards, if an increase in costs occurs. And shift downwards, if there is a decrease in costs in the economy.
1. Cost of labor
As an economy grows, individuals will argue for higher salaries pushing up the cost of labor. The existence of trade unions in some economies is likely to be a cause of such increases. This will be particularly true if an economy has strong labor protection laws or strong unions with large numbers of members.
The government may introduce or increase an existing minimum wage. A minimum wage is a wage rate that works as a minimum price, for example, the federal minimum wage in the US is USD$7.25 per hour. This means that a firm must pay at least USD$7.25 per hour to employ staff. Therefore, it is true to state that a minimum wage increase (or introduction) will lead to an upward shift of SRAS1 to SRAS2.
2. Cost of raw materials
Materials used in the production of goods and services will affect the Short-Run Aggregate Supply (SRAS). If the price of commodities increases, then the curve will shift upwards. Political upheavals in the Middle East has pushed up global oil prices, and global food prices are also increasing. These changes will affect the Short-Run Aggregate Supply (SRAS) by shifting the curve upwards. Please note it is also possible for commodity prices to fall causing the curve to shift downwards as seen in the diagram from SRAS1 to SRAS3.
Changes in the exchange rate may also have an effect on the price of raw materials, if they are imported. A strengthening currency means that imports are cheaper to purchase, whilst a weakening currency will make imports more expensive.
3. TAXation
Governments are able to change sales TAX levels, affecting firms’ costs. In the UK, an increase in TAX such as VAT which is a TAX on a firm’s output, will increase the cost to a firm, causing an upward shift of the Short-Run Aggregate Supply (SRAS), and vice versa.
Summary
In short, Aggregate Supply (AS) represents total supply in the economy. It is possible for the curve to shift, if there is a change in TAXation or the cost of labor and materials.
 Articles: 1,465 · Readers: 752,000 · Views: 2,244,142