This article is about supply. It shows The Supply Curve and helps to understand that a rise in price will lead to a rise in supply and vice versa. It identifies causes of shifts in The Supply Curve in real world situations.
What is supply?
Supply is the quantity of a product or service a producer is ’willing’ and ’able’ to offer for sale at each possible price.
As expected supply depends largely on price. The higher the price for a product, the more a business will be willing and able to supply
Price and supply
Supply will increase as new business are attracted by high profits coming from high price.
Businesses work harder to benefit from an increase in price. If the price falls, some business will reduce their production and others may go out of business or choose to leave the market.
A high price may attract producers, but some consumers may be unwilling and/or unable to buy. If this happens, over-supply may happen. This means more is produced than consumers want to buy.
The Supply Curve
Let’s take a look how the supply for Pepsi Cola changes depending on the price.
The price of Pepsi Cola (in USD$):
USD$1
USD$2
USD$3
USD$4
USD$5
Quantity of the producer is willing to supply (in units):
20,000,000
40,000,000
60,000,000
80,000,000
100,000,000
In principle, when the price of a good is high, it means that more companies are willing and able to supply products. Alternatively, when the price of a good is low, it means that less companies are not willing and able to supply products.
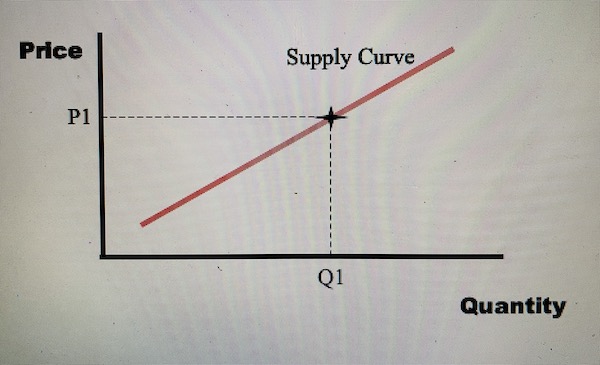
This relationship produces the upward sloping Supply Curve as seen above on the chart representing a typical Supply Curve.
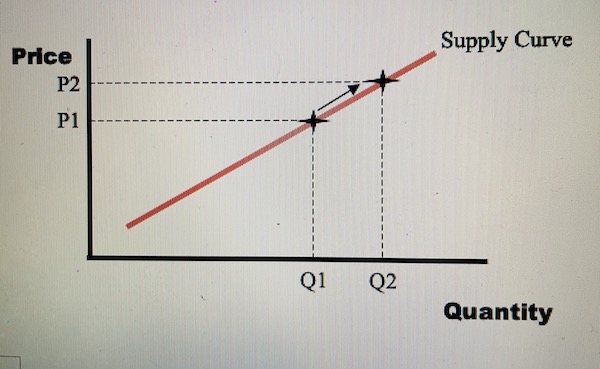
SCENARIO 1: Movement along The Supply Curve outwards
When the price changes on The Price & Quantity Graph, the change is described as a ‘movement along the curve’.
When the price of a product is high, it means that more companies are willing and able to supply products. Businesses will work harder to benefit from an increase in price. If the price increases, some business will increase their production and others may not go out of business or choose to leave the market.
As the price of Pepsi Cola increases (↑), the supply of Pepsi Cola increases (↑). Supply of products increases, if a product becomes more expensive.
This ‘movement along the curve’ happens because more companies will have the willingness and ability to supply the good or service.
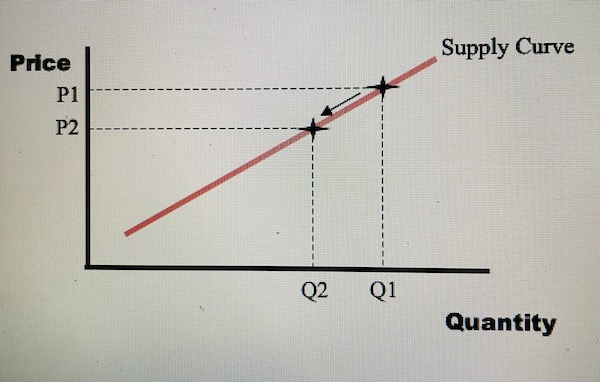
SCENARIO 2: Movement along The Supply Curve inwards
When the price changes on The Price & Quantity Graph, the change is described as a ‘movement along the curve’.
When the price of a product is low, it means that less companies are willing and able to supply products. Businesses will not work harder to suffer from a decrease in price. If the price decreases, some business will decrease their production and others may go out of business or choose to leave the market.
As the price of Pepsi Cola decreases (↓), the supply of Pepsi Cola decreases (↓). Supply of products decreases, if a product becomes cheaper.
This ‘movement along the curve’ happens because less companies will have the willingness and ability to supply the good or service.
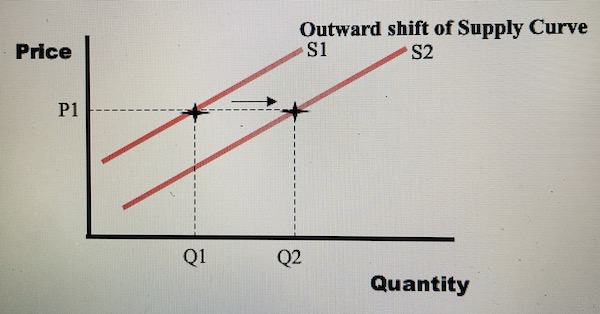
Shifts of The Supply Curve
A shift in The Supply Curve refers to the situation when the whole curve moves to the left or to the right.
A shift of the curve often happens for reasons other than price changes. An outward shift means an increase in quantity supplied at the same price. Alternatively, an inward shift of the curve represents a decrease in quantity supplied at the same price.
SCENARIO 1: Shift of The Supply Curve to the right
A shift to the right, or an outward shift of The Supply Curve, is when a greater quantity of Pepsi Cola is produced and supplied at any given price.
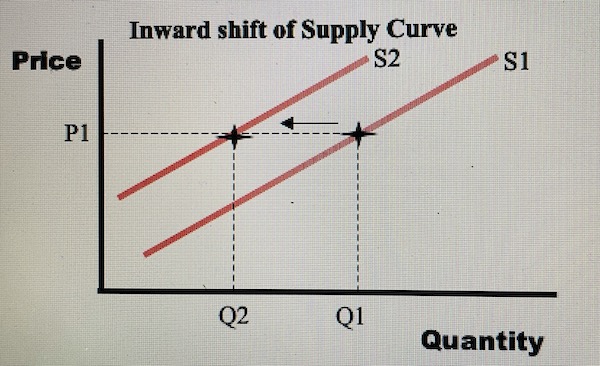
SCENARIO 2: Shift of The Supply Curve to the left
Conversely, a shift to the left, or an inward shift of The Supply Curve, is when a lower quantity of Pepsi Cola is produced and supplied at any given price.
What causes a shift of The Supply Curve?
These ‘shifts’ of The Supply Curve are caused by various economic factors listed over the page.
1. Cost of making the product. If the costs involved in making a product are increased then the amount supplied to the market may be affected. Some companies may choose decreas productton, or be forced to leave the market. Those that remain may be able to supply more since they have less competition and because they need to sell more to cover their higher costs, but total supply in the market will decrease leading to a shift to the left.
2. Technology. Advances in technology have several advantages to companies which cause the supply curve to shift to the right. New technology can greatly reduce costs, especially if it reduces the need for a labor-intensive operation. Labour-intensive refers to when the majority of costs are labour due to a high number of people being required to work for the market. Reducing the amount of labour means less paid in salaries. Lower costs allow more to be supplied for a given price.
3. Improved efficiency. Technological change not only causes a decrease in labour demand, but can mean that a company is more efficient. Efficiency may improve because a machine may produce much faster and with less mistakes than a human being. Machines do not take holidays nor need to sleep at night. Again, this leads to lower costs which can increase the total production a company is able and willing to supply to the market.
4. Better workforce. An alternative to replacing people is employing better people. A well trained workforce will work much quicker and more efficiently than a poorly/untrained workforce. Trained workers should make less mistakes. An increase in worker ability may cause a shift to the right
5. Price of factors of production. If the price of main factors of production including the land, labour or capital changes, it will affect production. For example, the raw materials used to produce a good, whether it is wood, steel, diamonds or oil, will cause inward shifts, if the price is higher or outward shifts if the price is lower.
6. Other products. Increases in the prices of other products can make a company’s current product seem less attractive. If other products become more profitable, suppliers may be tempted to ’switch’production to manufacture a different product. Of course, switching to produce a different product can be difficult depending on the industry and expertise of the company and its workers.
7. By-products. Alternatively, some products have ’by-products’. A by-product is a material, other than the main product generated as a consequence of an industrial process. For example, if more companies are selling beef as the result of an increase in beef prices, then the supply of leather, which is produced using cow skin, will also increase.
8. Government policy. There are many possible ways the government may affect supply in a market including:
• Foreign investments. The open-policy of China allowed local firms to open and attracted foreign firms to the market, causing an outward shift within markets in the country.
• Minimum wage. This is a good example of costs increasing is when the government introducing an enforced increase in the minimum wage. A minimum wage is the lowest amount of money an employee can be paid. The minimum wage level will increase the salaries of the lowest paid members of the labour force. An introduction of or increase in a minimum wage increases costs causing shift of The Supply Curve to the left.
• TAX. Companies are also TAXed by government. TAXes affect the costs which a company experiences and therefore affect supply levels accordingly. An increase in TAX may force some companies to leave the market, so it will lower supply.
• New law. Another major way a government can intervene is through legislation. For example, new legislation introduced regarding health and safety environment may force firms to buy new equipment or introduce more expensive procedures. An increase in costs may occur casuing shift of The Supply Curve to the left.
9. Expectations. If sellers expect prices to increase, they may decrease supply and stockpile their product for when the price increases. After the price has increased they can then sell the product they have stockpiled. Stockpile is to keep goods from the market, perhaps in a warehouse.
10. Natural disasters. Natural disasters can also decrease supply. The recent earthquake and tsunami that hit northern Japan reduced the supply of many firms. Infrastructure was damaged and many firms were unable to have access to necessary resources to continue production.
11. Strikes. A workforce strike or a walk-out will halt production and cause a dramatic decrease in the supply of a product. Workers usually refuse to work due to poor pay or poor working conditions.
Summary
In short, supply is the amount businesses are willing to sell in the market at a given price. As well as being affected by price, it is also influenced by costs, competition, technology, government policies, expectations of future price changes and even unexpected factors such as natural disasters and climate change
When supply changes because of price, it causes a ‘movement along the curve’ on The Price & Quantity Graph. When supply changes because of other factors, it causes ‘shifts’ of The Supply Curve to the right or to the left.
