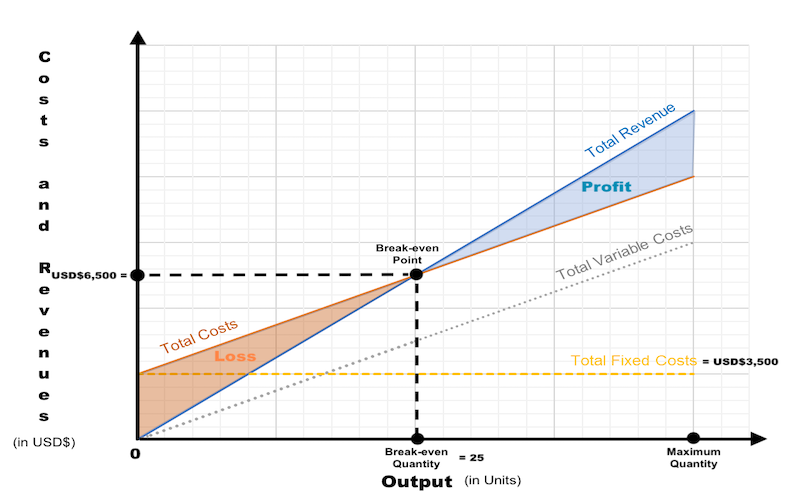
To properly construct the Break-even Chart, we need to plot the curves that indicate Sales Revenue and Total Costs (TC). The Sales Revenue and costs information at 0 Output level and maximum Output level is used to produce the Break-even Chart.
To construct an accurate Break-even Chart, use the following five rules.
STEP 1: Let’s start with adding the title to the chart. Then, the x-axis is labelled as ‘Output (in units)’ and the y-axis is labelled as ‘Costs and Revenues (in USD$)’, or any other currency. The x-axis must go to beyond Break-even Output while the y-axis must go beyond Sales Revenue at Break-even Point. So, potential profit at maximum Quantity can be indicated on the chart.
STEP 2: Start with the costs’ curves, and then do the sales-revenue curve.
STEP 3: Costs first. First the three costs’ lines must be drawn and labelled correctly.
– Fixed Costs (FC). It is conventional to draw and label the Fixed Costs (TC) line. Fixed Costs (FC) are the same at 0 Output, the same at Break-even Quantity, and the same at maximum Output. The fixed-cost line is horizontal, showing that Fixed Costs (FC) are constant at all Output levels. This is because we assume that Fixed Costs (FC) are the same and will not change within one year.
– Variable Costs (VC). Variable Costs (VC) at 0 Output and Break-even Output need to be indicated. The variable-cost line starts from the origin 0, because if no goods are produced, there will be no Variable Costs (VC). Variable Costs (VC) increase as Output continues to increase. Variable Costs (VC) at maximum Output are calculated as the Average Variable Cost (AVC) multiplied by maximum Output.
– Total Costs (TC). The Total Costs (TC) line is drawn and labelled. Recall that even when there is no Output, Fixed Costs (FC) still have to be paid. Hence, the Total Costs (TC) line starts at the same level as Fixed Costs (FC). Total Costs (TC) at 0 Output and at maximum Output need to be indicated. The total-cost line begins at the level of Fixed Costs (FC). Fixed Costs (FC) plus Variable Costs (VC) give Total Costs (TC) at any given Output.
STEP 4: Sales Revenue second. Now, the total Sales Revenue line must be drawn and labelled. Sales Revenue at 0 Output and at maximum Output. Sales Revenue always starts at the origin 0 because, if no sales are made, there is no Sales Revenue. Using this information, it is now possible to plot the Break-even Chart.
STEP 5: The point at which the total-cost and sales-revenue lines cross each other is Break-even Point, so mark it properly on the chart. Break-even Point indicates the Costs and Revenues at Break-even Quantity.
Let’s take a look at the real-life example. This time we are constructing the Break-even Chart by finding out Break-even Quantity.
A sole trader sells dresses at the price of $260. The Average Variable Costs (AVC) to produce one dress are USD$120 per unit. The Fixed Costs (FC) for renting a workshop and paying interest on the bank loan are USD$3,500.

To construct the Break-even Chart, it is necessary to first calculate Break-even Quantity. Using The Equation Method 2: Break-even Quantity (BEQ), the Contribution Per Unit can be calculated, and the Break-even Quantity can be worked out as:

Break-even Quantity (BEQ) = Fixed Costs (FC) / Contribution Per Unit

Break-even Quantity (BEQ) = USD$3,500 / (USD$260 – USD$120)
Break-even Quantity (BEQ) = 25

So, the sole trader must produce and sell 25 dresses to break-even.

Now, let’s calculate the value of Costs and Revenues at the Break-even Quantity. Since the value of Total Costs (TC) and Sales Revenue are the same at the Break-even Quantity, it does not matter which component is worked out. Let’s calculate Total Costs (TC) though:

Total Costs (TC) = Fixed Costs (FC) + Total Variable Costs (TVC)

Total Costs (TC) = USD$3,500 + (USD$120 x 25)
Total Costs (TC) = $6,500

Equally, if we calculate the Sales Revenue, the figure would be the same:

Sales Revenue = USD$260 x 25 = USD$6,500

So, if the sole trader produces and sells 25 dresses, Total Costs (TC) will be USD$6,500 and Sales Revenue will also be USD$6,500.
The Break-even Chart for the above example, will then look like this:

Break-even Point indicates the costs and revenues at Break-even Quantity. The point at which the total-cost line and sales-revenue line cross each other is Break-even Point.
